District → Guntur
Guntur is a district in the Andhra Pradesh of India. Covering a total area of 11391 km², Guntur is home to a population of 4887813 people as per the 2011 census. The district has a population density of 429.1 inhabitants per square kilometre and comprises about 1296609 houses. district includes approximately 691 villages.
For administrative purposes, the Guntur district is divided into Mandals, Blocks, Police Stations (PS), and Community Development Blocks (C.D.Blocks). In India, a C.D.Block represents the next level of administrative division after the Mandal in many regions. Its important to note that in some Indian states, C.D.Blocks are synonymous with Mandals.
A C.D.Block is a designated rural area for administration and development in India. It is managed by a Block Development Officer (BDO) and encompasses several gram panchayats, which are local administrative units at the village level.
The largest Mandal in Guntur district is Bollapalle, which spans an area of 707 km², while Pittalavanipalem is the smallest Mandal with an area of 71 km². Guntur is also the most populous Mandal with 779289 people, whereas Savalyapuram H O Kanamarlapudi is the least populous with 37994 people. There are 56 Mandals in Guntur district.
| # | Mandals(CD Block) | Area (km²) | Population (2011) | Density (km²) |
|---|---|---|---|---|
| 1 | Amaravathi | 213 | 66277 | 312 |
| 2 | Amruthalur | 125 | 44713 | 359 |
| 3 | Atchampet | 211 | 58447 | 276 |
| 4 | Bapatla | 266 | 143825 | 541 |
| 5 | Bellamkonda | 358 | 38455 | 108 |
| 6 | Bhattiprolu | 96 | 50252 | 526 |
| 7 | Bollapalle | 707 | 58086 | 82 |
| 8 | Chebrolu | 131 | 72141 | 552 |
| 9 | Cherukupalle H O Arumbaka | 97 | 60385 | 620 |
| 10 | Dachepalle | 286 | 75233 | 263 |
| 11 | Duggirala | 146 | 62655 | 428 |
| 12 | Durgi | 447 | 49059 | 110 |
| 13 | Edlapadu | 182 | 56321 | 309 |
| 14 | Guntur | 193 | 779289 | 4,036 |
| 15 | Gurazala | 261 | 66070 | 253 |
| 16 | Ipur | 204 | 46714 | 229 |
| 17 | Kakumanu | 179 | 40681 | 227 |
| 18 | Karempudi | 222 | 52367 | 236 |
| 19 | Karlapalem | 105 | 50320 | 479 |
| 20 | Kollipara | 111 | 56662 | 511 |
| 21 | Kollur | 118 | 55323 | 469 |
| 22 | Krosuru | 163 | 56308 | 344 |
| 23 | Machavaram | 200 | 52469 | 263 |
| 24 | Macherla | 303 | 113048 | 373 |
| 25 | Mangalagiri | 141 | 160303 | 1,135 |
| 26 | Medikonduru | 137 | 60144 | 440 |
| 27 | Muppalla | 132 | 42509 | 322 |
| 28 | Nadendla | 166 | 68978 | 416 |
| 29 | Nagaram | 143 | 50262 | 351 |
| 30 | Narasaraopet | 236 | 211948 | 899 |
| 31 | Nekarikallu | 252 | 63349 | 252 |
| 32 | Nizampatnam | 187 | 59973 | 321 |
| 33 | Nuzendla | 353 | 52853 | 150 |
| 34 | Pedakakani | 120 | 73689 | 616 |
| 35 | Pedakurapadu | 140 | 50030 | 359 |
| 36 | Pedanandipadu | 141 | 41980 | 297 |
| 37 | Phirangipuram | 147 | 63449 | 431 |
| 38 | Piduguralla | 261 | 122319 | 468 |
| 39 | Pittalavanipalem | 71 | 38609 | 541 |
| 40 | Ponnur | 172 | 123417 | 717 |
| 41 | Prathipadu | 122 | 49390 | 405 |
| 42 | Rajupalem | 165 | 45213 | 273 |
| 43 | Rentachintala | 198 | 49827 | 251 |
| 44 | Repalle | 267 | 111989 | 419 |
| 45 | Rompicherla | 227 | 62060 | 274 |
| 46 | Sattenapalle | 237 | 130608 | 551 |
| 47 | Savalyapuram H O Kanamarlapudi | 147 | 37994 | 258 |
| 48 | Tadepalle | 73 | 99428 | 1,361 |
| 49 | Tadikonda | 187 | 67962 | 364 |
| 50 | Tenali | 114 | 240031 | 2,101 |
| 51 | Thullur | 185 | 54081 | 292 |
| 52 | Tsundur | 106 | 45778 | 434 |
| 53 | Vatticherukuru | 117 | 45773 | 392 |
| 54 | Veldurthi | 528 | 49054 | 93 |
| 55 | Vemuru | 103 | 43586 | 423 |
| 56 | Vinukonda | 281 | 112498 | 400 |
The population is distributed between urban and rural areas as follows:
| Particulars | Rural | Urban | Total |
|---|---|---|---|
| Total Population | 3235075 | 1652738 | 4887813 |
| Male Population | 1621491 | 819030 | 2440521 |
| Female Population | 1613584 | 833708 | 2447292 | Population Density | 292 / km² | 5239 / km² | 429.1 / km² |
The distribution of households in the Guntur is:
| Rural Households | Urban Households | Total Households |
|---|---|---|
| 877464 | 419145 | 1296609 |
Showing 1 of 1 places
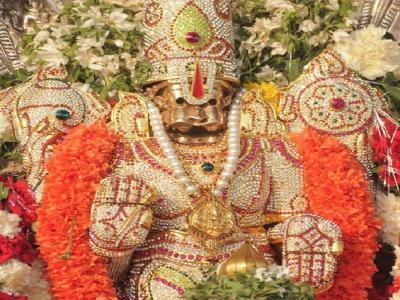
The Panakala Lakshmi Narasimha Swamy Temple is a prominent Temple dedicated to Lord Lakshmi Narasmiha Swami located in
Q: What is the total area of Guntur district?
A: The total area of Guntur district is 11391 km².
Q: What is the population of Guntur district according to the 2011 census?
A: According to the 2011 census, the population of Guntur district is 4887813.
Q: How many villages are there in Guntur district?
A: There are approximately 691 villages in Guntur district.
Q: What is the population density of Guntur district?
A: The population density of Guntur district is 429.1 inhabitants per square kilometre.
Q: How many houses are there in Guntur district?
A: There are about 1296609 houses in Guntur district.
Q: How is the Guntur district administratively divided?
A: For administrative purposes, Guntur district is divided into Mandals, Blocks, Police Stations (PS), and Community Development Blocks (C.D.Blocks).
Q: What is a C.D.Block in India?
A: A C.D.Block (Community Development Block) is a designated rural area for administration and development in India, managed by a Block Development Officer (BDO) and encompassing several gram panchayats.
Q: Which is the largest Mandal in Guntur district by area?
A: The largest Mandal in Guntur district by area is Bollapalle, which spans an area of 707 km².
Q: Which is the smallest Mandal in Guntur district by area?
A: The smallest Mandal in Guntur district by area is Pittalavanipalem, with an area of 71 km².
Q: Which Mandal in Guntur district has the largest population?
A: The Mandal with the largest population in Guntur district is Guntur, with a population of 779289 people.
Q: Which Mandal in Guntur district has the smallest population?
A: The Mandal with the smallest population in Guntur district is , with a population of 37994 people.
Q: How many Mandals are there in Guntur district?
A: There are 56 Mandals in Guntur district.
Q: What is the male population of Guntur district?
A: The male population of Guntur district is 20,727.
Q: What is the female population of Guntur district?
A: The female population of Guntur district is 16,115.
Q: How many villages in Guntur district have a population of less than 100?
A: There are 26 villages in Guntur district with a population of less than 100.
Q: How many villages in Guntur district have a population between 100 and 499?
A: There are 15 villages in Guntur district with a population between 100 and 499.
Q: How many villages in Guntur district have a population between 500 and 999?
A: There are 34 villages in Guntur district with a population between 500 and 999.
Q: How many villages in Guntur district have a population between 1000 and 1999?
A: There are 113 villages in Guntur district with a population between 1000 and 1999.
Q: How many villages in Guntur district have a population between 2000 and 2999?
A: There is 92 village in Guntur district with a population between 2000 and 2999.
Q: How many villages in Guntur district have a population between 3000 and 3999?
A: There is 99 village in Guntur district with a population between 3000 and 3999.
Q: How many villages in Guntur district have a population between 4000 and 4999?
A: There is 86 village in Guntur district with a population between 4000 and 4999.
Q: How many villages in Guntur district have a population of 5000 and above?
A: There is 237 village in Guntur district with a population of 5000 and above.
| Total Population | Villages in Sub District Of Guntur |
|---|---|
| Less than 100 | 26 |
| 100-499 | 15 |
| 500-999 | 34 |
| 1000-1999 | 113 |
| 2000-2999 | 92 |
| 3000-3999 | 99 |
| 4000-4999 | 86 |
| 5000 And Above | 237 |